This Twitter pitch deck was used to raise investments for their IPO. That was before Elon’s acquisition. They convinced the world that they had a good product, and accordingly, the world invested in them on their IPO day around $1.8 billion.
Before we start analyzing this deck, you should know that 96% of my time is invested in my substack (750k views and 12k readers); Here’s a link if you wish to become part of my network. Oh, and you get access to all 100 Editable Real Content Templates that we created.
Firstly, here’s a video that I spent 8 hours working on to analyse this deck more beautifully.
The Twitter IPO Pitch Deck in PDF
Feel free to download and surf through it. Now let’s analyze it.
Deck Analysis
This introduced Twitter to the public so that everyone, like you and me, would invest in Twitter. So we need good introductions, and that’s how they started.
They start off by saying where they are incorporated, the number of employees they have, and the monthly active users. Then they showcase what Twitter is in terms of main functionality (a tweet.)
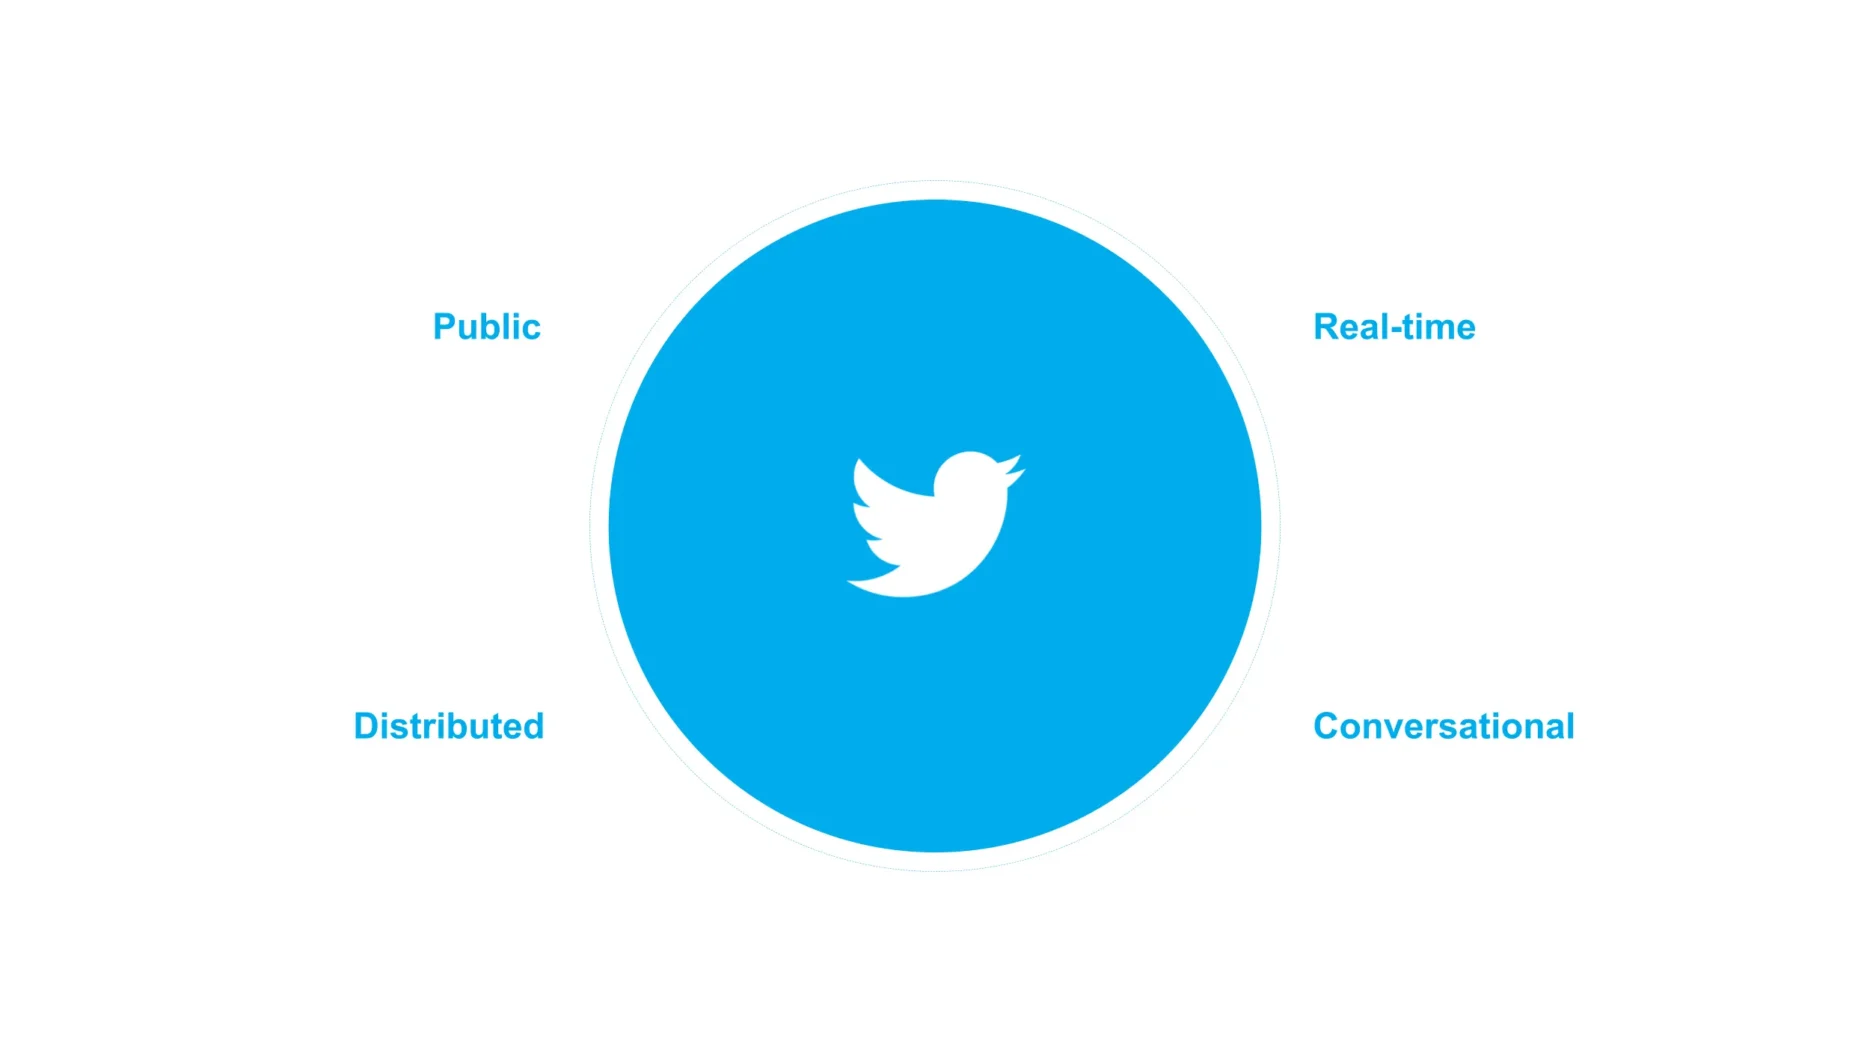
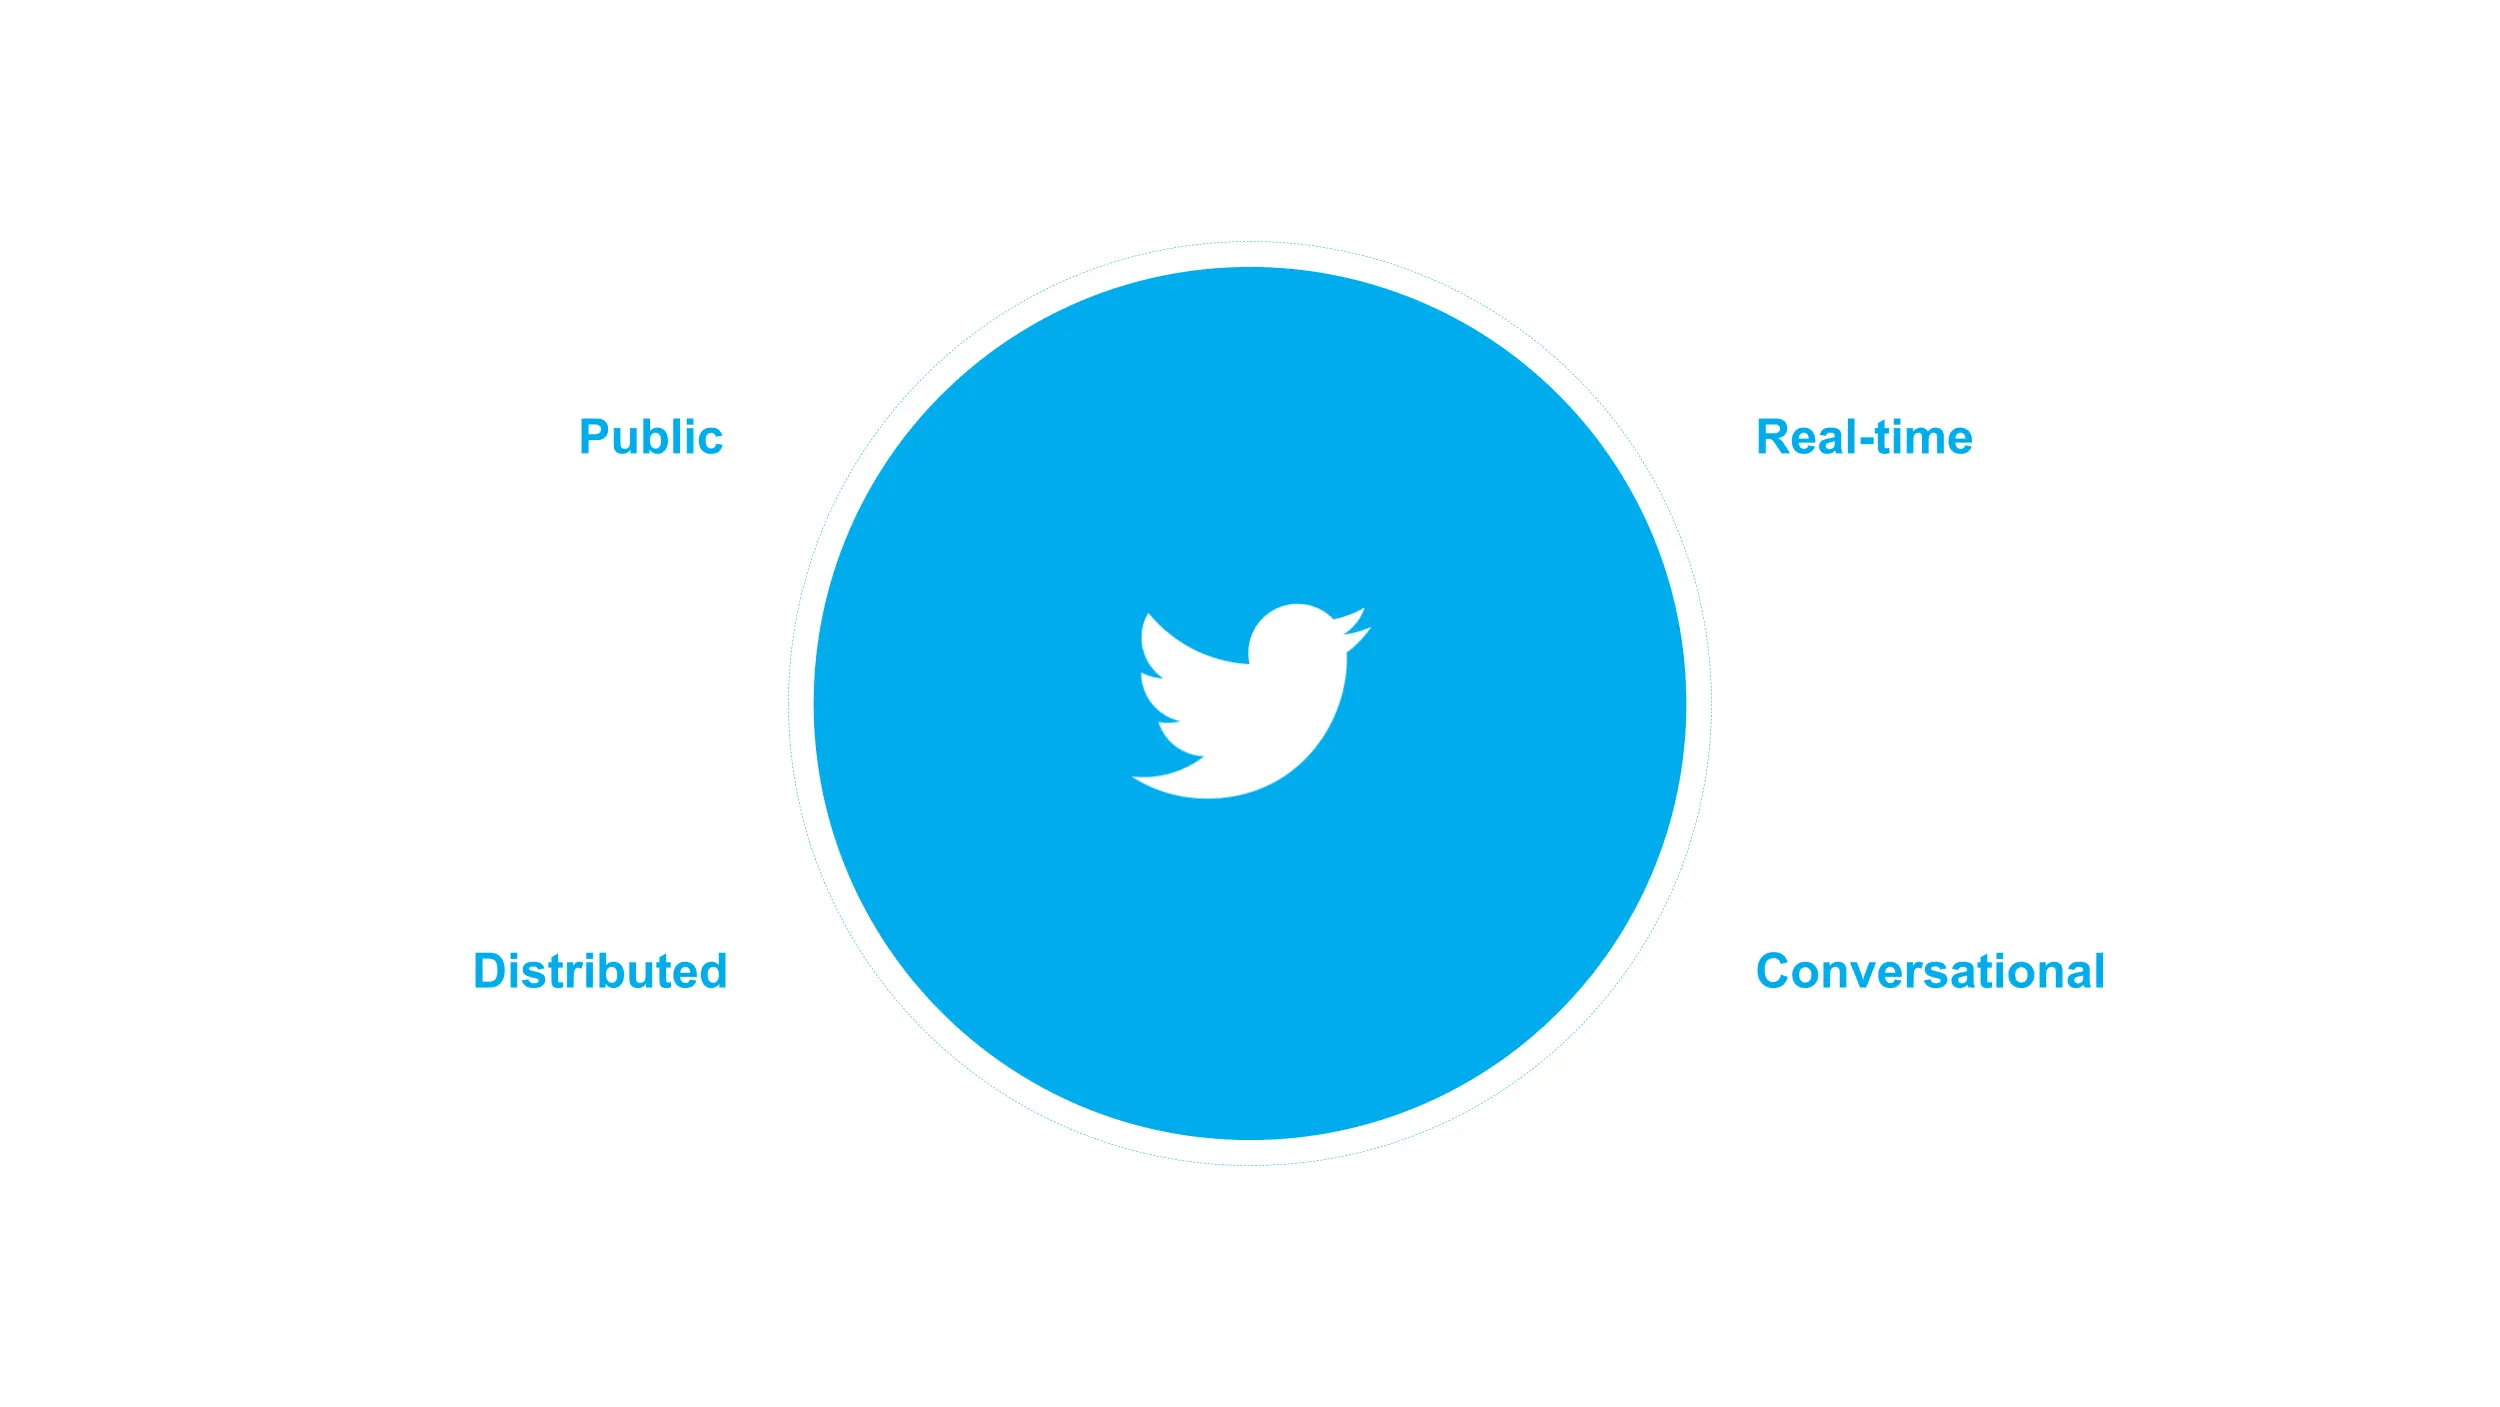
Their statistics were gold. Twitter starts showcasing some of them, like “350 billion tweets published since being founded and 1 billion every two days.” They continue showcasing further traction and then showcase the main selling points of Twitter, being Public, Distributed, real-time, and Conversational. Then they display use cases for each of those. They then continue with their stats and traction.
They thoroughly showcase the value propositions to each of their stakeholders (users, platform partners, and advertisers.) You have to keep in mind that this IPO deck is supposed to get support from everyone. So they have to convince all their target segments in a single presentation.
After that, they need to discuss the future and what most investors care about the most – Growth.
Of course, it’s essential to put a face to it. So they display their management team. You’ll notice that Jack Dorsey is not there as this was after his time. Then they start talking numbers. They discuss annual and advertising revenue followed by the most important metrics of Q3, like the monthly active users.
They dig in into the views of each of their UI elements or features like the “timeline.” Then they have to address the ad revenue, as that is the main source of income for such a social media startup.
They close this deck by just showcasing some further statistics and numbers in case people were interested in their financial model.
Meet The Author Of This Article

